Wildfire has unfortunately become an increasing part of the summer visitor experience in Southern Oregon. While there have been few direct threats to visitors, infrastructure damage to wildland assets such as trailheads, campgrounds and even lodging properties pose challenges to industry partners and visitors. Perhaps the most persistent and problematic element of increased wildfires across the region has been the detrimental economic impact of wildfire smoke.
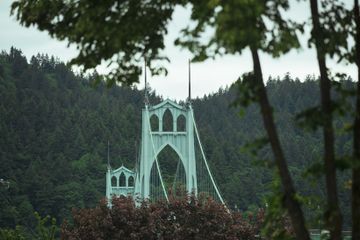
The 2018 wildfire season, which culminated in the partial or total closures of popular attractions like the Oregon Shakespeare Festival, the Britt Festival, and negatively impacted the experience of pristine outdoor recreation assets like Crater Lake National Park, the Oregon Caves Monument and the Rogue and Umpqua rivers, was particularly hard on the region.
In the wake of that devastating summer, TSO embarked on a Visitor Perception Studyto gauge visitor sentiment about Southern Oregon as a travel destination. The good news was that most visitors understood wildfire as an elemental part of the Western landscape and were still very positive towards Southern Oregon as a destination. The key finding was that visitors wanted up-to-date information around wildfires and smoke to help inform decisions and have the best experience possible.
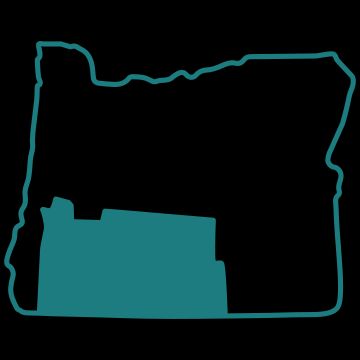
With this information, TSO went into a partnership with a Grants Pass-based company called APIS, which specializes in air-quality monitoring in a variety of industrial and environmental settings. The goal was to invest in a regional online consumer-facing dashboard that would aggregate existing Oregon DEQ air quality sites with new TSO-installed smoke monitors at key attractions across the region to help give visitors (and frontline industry staff) a real-time snapshot of wildfire smoke conditions. TSO purchased and installed six smoke monitors, which, when added to 10 existing DEQ stations, creates a full view at any given moment of real-time smoke conditions across the region.
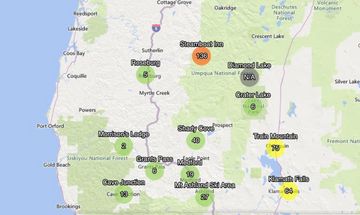
An interesting challenge that arose, was a perception on the part of some attractions that sharing real-time air quality data from their location might deter visitation. TSO worked to assure attractions that visitors want accurate information, whatever it is, to make informed decisions. Whether it’s communicated, or not, visitors will quickly notice smoky conditions on arrival, and many venues themselves are required to ultimately adjust their operations if conditions deteriorate too much.
Another important element of this work, which truly benefited the whole Oregon tourism industry, is that TSO was able to ensure visitors to Oregon had a positive experience, even if it was not in Southern Oregon. If air quality was bad at any given time, it was very easy to recommend a change of plans to visit the Coast or Central Oregon where smoke levels were lower or non-existent. The goodwill generated by communicating honestly with visitors, and with the quality of their Oregon experience in mind, will keep a visitor an Oregon fan for life. TSO knows visitors will return to Southern Oregon when conditions are better, and that their positive experience elsewhere in the state lifts us all.